
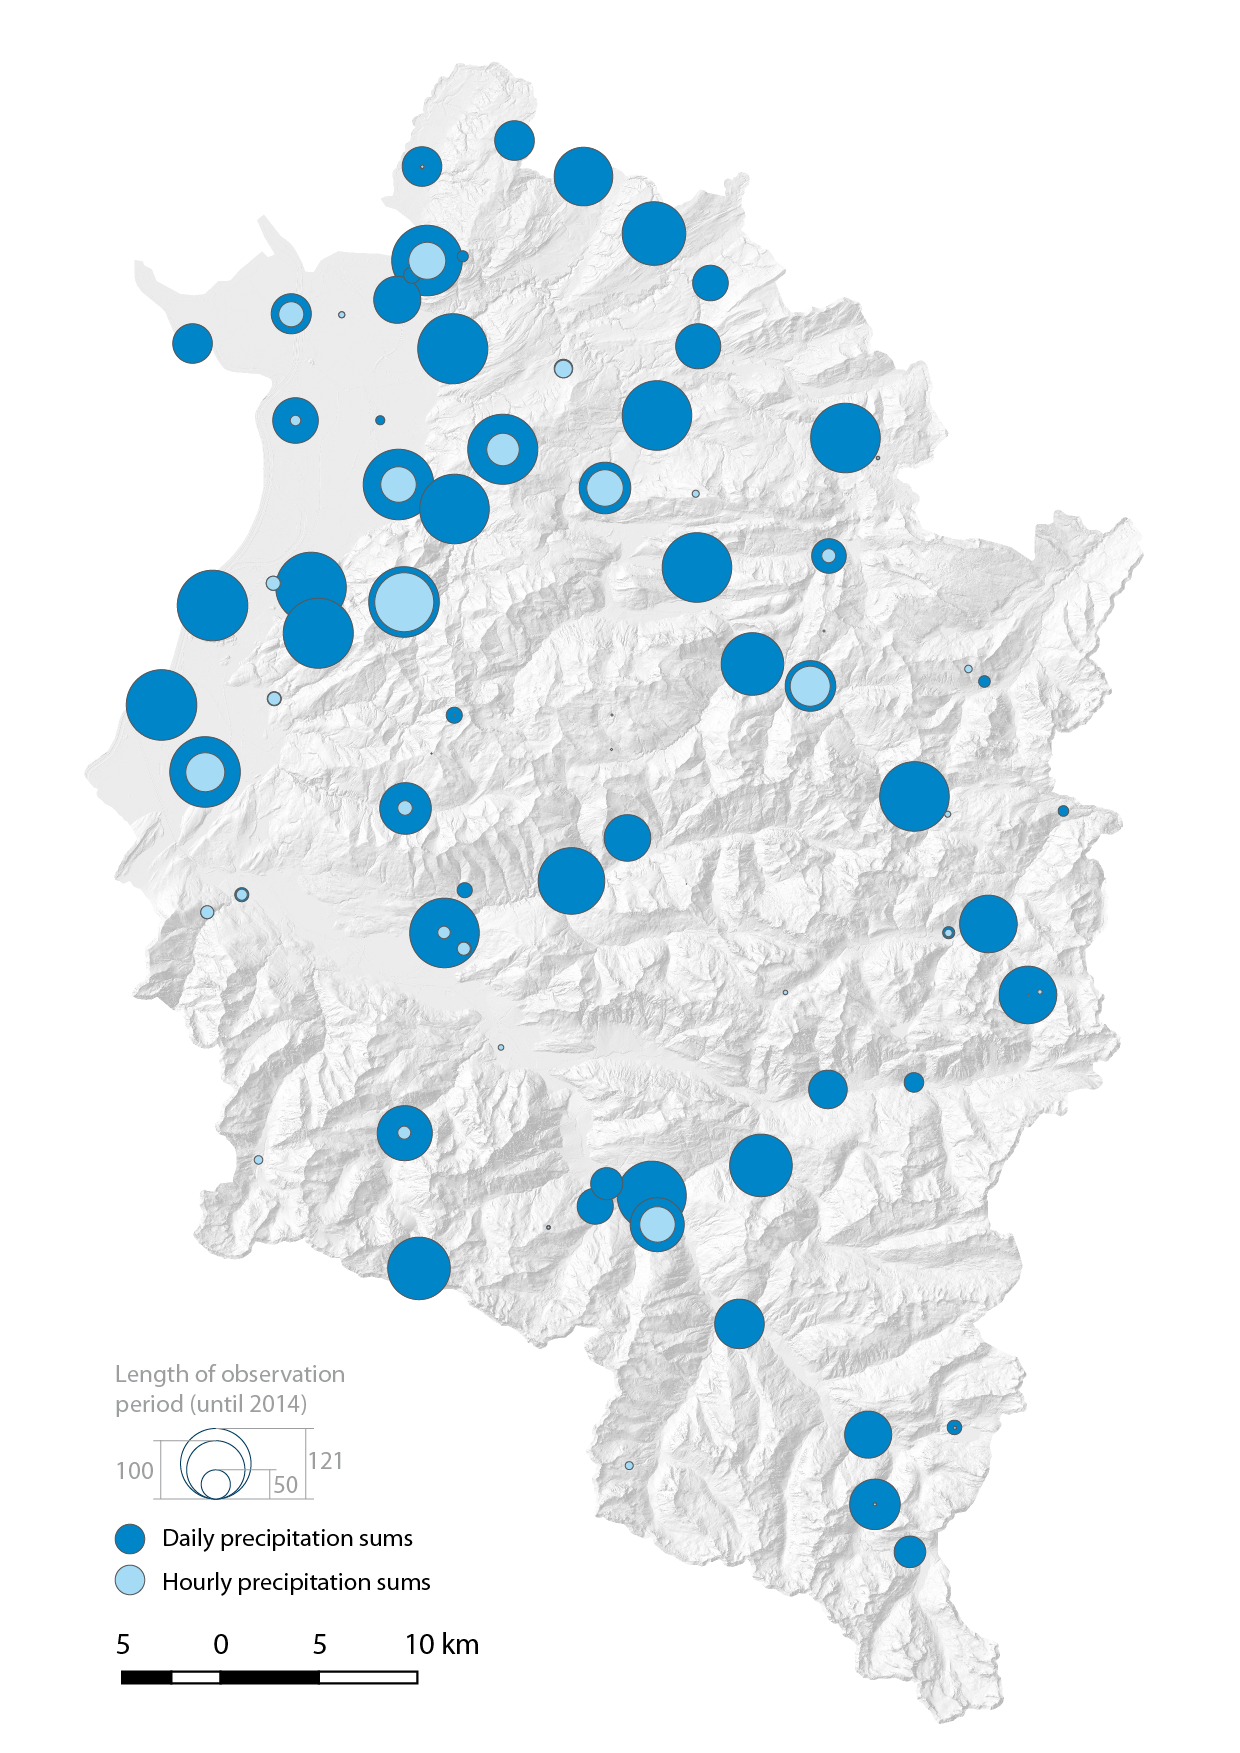
The map below shows the location and length of observation period (until 2015) of 79 rain gauges operated by the Hydrographic Service throughout the state of Vorarlberg (ZAMG gauges not included). The size of the dark blue colored circles indicates the length of the observation period for daily precipitation sums, light blue circles show the same for hourly sums. For the assessment of potentially landslide-triggering amounts of precipitation the time series will be analysed for dated landslide events. We hereby want to thank the Hydrographic Service of Vorarlberg for kindly providing the data.
-
Archives
- July 2017
- June 2017
- April 2017
- November 2016
- June 2016
- April 2016
- February 2016
- December 2015
- November 2015
- June 2015
- March 2015
- January 2015
- November 2014
- October 2014
- September 2014
- July 2014
- June 2014
- May 2014
- March 2014
- February 2014
- January 2014
- November 2013
- October 2013
- September 2013
- August 2013
- July 2013
- June 2013
- May 2013
- April 2013
- March 2013
-
Meta